


The US is fortunate to have a group of ten federal agencies, called Multi-Resolution Land Characteristics (MRLC) Consortium, that coordinate land cover information and imagery provided by the Landsat 5 and Landsat 7 satellites. They collaborate to create the National Land Cover Database (NLCD), where the primary objective is stated as:
The primary objective of the MRLC NLCD is to provide the Nation with nationally complete, current, consistent and public domain information on the Nation’s land cover. Land cover information is critical for local, state and federal managers and officials to assist them with issues such as assessing ecosystem status and health, modeling nutrient and pesticide runoff, understanding spatial patterns of biodiversity, land use planning, deriving landscape pattern metrics and developing land management policies.
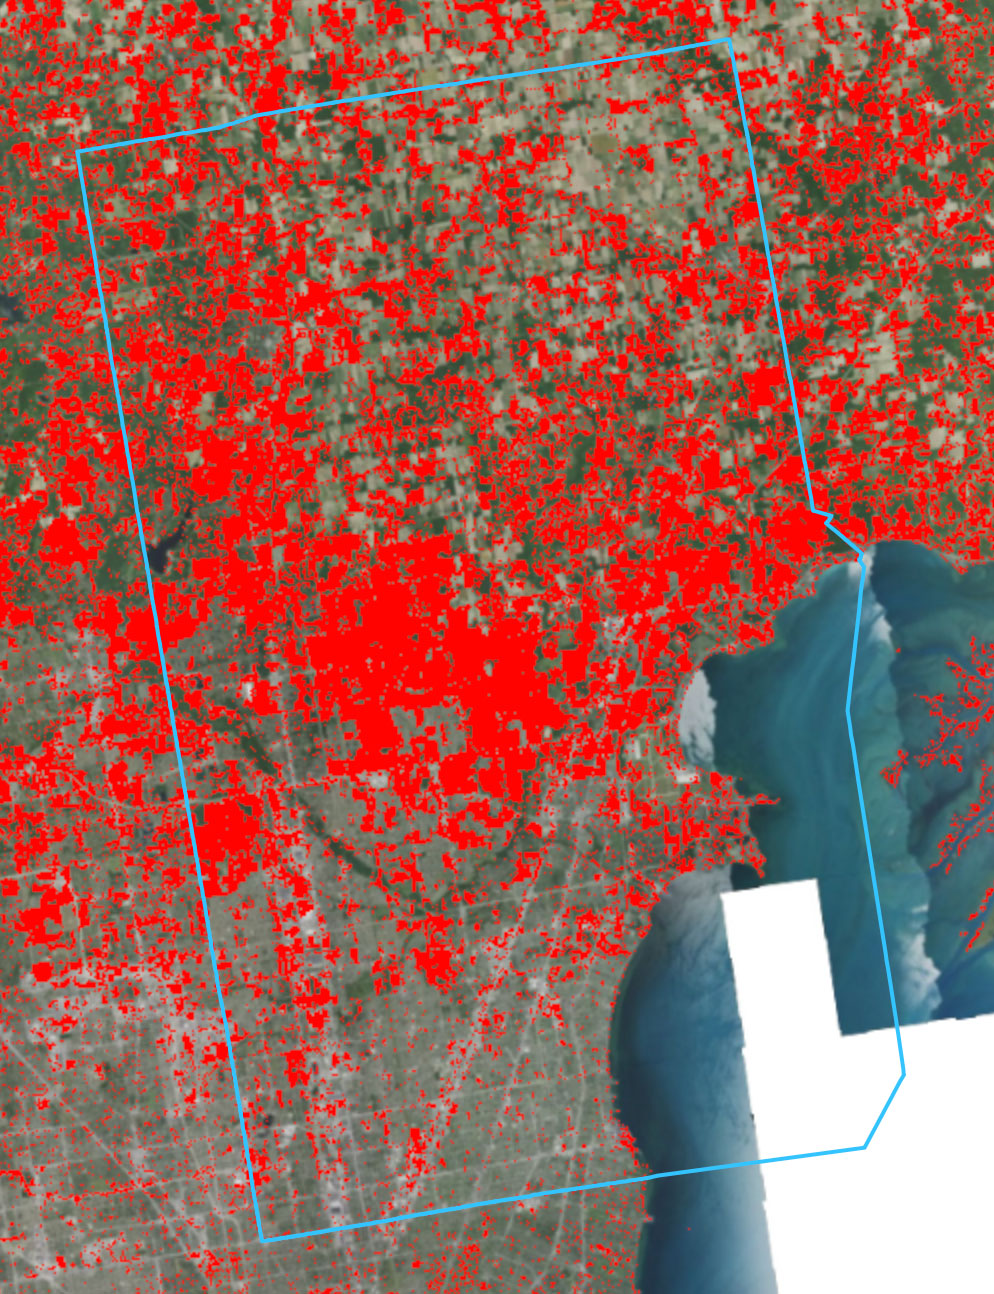
Recently, they released an Enhanced Visualization and Analysis (EVA) Tool, which “provides users with detailed county statistics for any two NLCD landcover dates to support quick and powerful change analyses.” It allows anyone to examine land change characteristics across the country from 1985 to 2024, down to the county level in each State. While statistical data, such as the percentage areas of change, are focused at the county level, one can examine individual cities visually to note areas of significant change. The major modules examine general changes in land cover types, developed areas, forest changes, wetland changes, and agricultural changes.
Macomb County in General
For example, overall, Macomb County general statistics show, according to the most recent EVA data (for the period 1985-2024):
| EVA Module | Change |
|---|---|
| Land Use Changes (General) | 🔺 29.11% |
| Net increase Developed Area | 🔺 30.87% |
| Net increase Impervious Surface Area | 🔺 48.79% |
| Percent area forested | 🔺 0.2% |
| Percent area wetlands | 🔻 9.41% |
| Percent area Agriculture | 🔻 33.83% |
It is good to remind ourselves that this is just data. Data doesn’t have any agenda or motives. It is up to us to decide what to do with it. It’s evident from these figures that a large portion of Macomb County has been converted from agricultural lands to developed areas. That’s no surprise to anyone who has driven the area to see farm after farm converted to subdivisions, buildings, and parking lots. With that also came a substantial increase in impervious surfaces and losses of wetlands.
The percentage change in net area forested may come as a surprise to some, but keep in mind that this is also associated with a relatively low overall forest area in Macomb County. The EVA tool notes that Macomb had 6.47% forested area overall in 1985, compared to 6.49% in 2024. A good portion of the county was deforested long before 1985 (to create those agricultural lands), and little has been done to improve it.
Given the highly publicized attention to sewer overflows, the increased intensity of rainfall, combined with the addition of impervious surfaces and the decrease of wetlands, adds more stress to our drainage systems, which were designed for rainfall patterns over 50 years ago. This is a consequence that will ultimately drive up the costs of maintaining our water quality and infrastructure, and increase flooding risks when capacities are exceeded.

What about Sterling Heights?
As mentioned, the NLCD EVA tool unfortunately doesn’t provide for detailed percentages down to the local municipality level. But you can generate visualizations to examine the areas of the most significant changes. For a more in-depth understanding, the operational definitions and resolutions of the data can be found on the MRLC site. It is good to keep these in mind when comparing them to other tools, as they may not be using the same definitions. The resolution won’t provide for individual tree losses, for example, but only areas within the parameters they defined.
Sterling Heights Land Use Change 1985-2024

Sterling Heights Forested Area Change 1985-2024

Sterling Heights Wetland Losses 1985-2024

Sterling Heights Development Areas 1985-2024

At face value of the information provided by the MRLC EVA tool – If there are lessons to be learned from the Macomb-specific data, it shows forest loss, wetland loss, and habitat losses, once gone, are likely not to come back or be restored. Those come with an ultimate cost. And suppose development is taking place with isolated considerations, unchecked, and without keeping an eye on the overall data picture (such as each municipality within Macomb County). In that case, it will have long-term regional and local consequences, just as we experience today. It leaves you wondering …
Where are all those reported economic benefits going if our water infrastructure remains critically underfunded and yet our water bills keep going up❓
Leave a Reply